Better decisions
Why don't dashboards explain why numbers changed?
Dashboards show that a number moved, not what moved it. How to split a change between its drivers, and why the maths should not come from a model.
· 13 Nov 2026 · 7 min read
A dashboard is built to show that a number moved and where it moved, and the reason usually sits across several tables and a few documents that no single chart joins. Explaining a change means splitting it between its drivers, and that split should come from a query you can rerun.
Accountants have been doing half of this work for decades. The other half, who does the arithmetic, is what I would ask about first with any reporting or AI tool, ours included.
What do buyers say when a demo shows them their own numbers?
About 6% of the businesses we spoke to over the past year asked us a version of “isn’t this the reporting we already have?” One prospect put it more sharply than the rest. After a demo, they called what they had seen a “nice regurgitation of information we would already know” and asked for the drivers underneath the P&L.
They were right to say it. Seeing revenue by region a second time is worth little to the team that built the report. They wanted the next layer down: the customers and price changes adding up to the movement on the summary line. If you are sitting where they were, ask us your own question and we will work through it with you on your numbers.
What is the fair test for any report, AI or not?
Any report, AI or not, earns its place by telling you something new, saving real work or changing a decision. Our customer research left us with that test, and it works as well on a dashboard as on anything with a model inside it. A report should do at least one of these:
shows you something you did not already know
removes work an analyst was doing by hand
changes a decision you were about to make

A well-built dashboard can pass all three: the stock alert that fires when a line drops below its reorder level changes what gets ordered. A demo that replays the board pack passes none of them, however good the interface looks. The test applies to Unloq too, and when a demo of ours fails it, the prospect is right to tell us.
Why can’t a dashboard tell you why a number moved?
Dashboards are good monitors of a known set of measures, cut by the dimensions somebody chose when the data model was built, so they answer only the questions that person expected to be asked. Revenue by region against budget is exactly their job.
“Why did it move?” asks for something else. Answering it means breaking the change down across dimensions nobody pinned to the page in advance, and often reading something outside the warehouse, such as a price list that changed halfway through the quarter. In the businesses we work with, that work is mostly done by hand: an analyst exports three views, joins them in a spreadsheet and writes a paragraph for the finance director. It can take days, and the paragraph rarely shows its arithmetic.
General-purpose AI assistants struggle here for reasons covered in why “what is the number?” and “why did it move?” are different questions.
How do you split a KPI change between its drivers?
You give each driver a share of the total change and check that the shares add back to it. Management accountants worked this out long before anyone called it analytics, and they deserve more credit than my side of the industry gives them. Variance analysis, as the OpenStax Principles of Managerial Accounting textbook lays it out, compares actual results with a standard and splits the gap into parts: a price variance for paying more per unit, a quantity variance for using more units. The textbook’s worked example has materials bought at $16 a pound against a standard of $15, which comes to a $50,000 unfavourable price variance on 50,000 pounds.
The part I like best is who explains the result. The chapter says the management responsible for the variances must explain any variances outside of a certain range. The accountants do the split, and the manager responsible owns the why.
The general method for any measure follows that shape, and the check is the same: if the shares do not add back to the total, something is counted twice or missing. Unloq’s split always adds back to the full change. Watch for mix as well as rate: revenue can drop with every price held, because more of the sales came from a cheaper region, which is often the first answer to “why did revenue drop?”
Mariya Mansurova, a product analytics leader at Wise, gives a useful check in her Towards Data Science guide to KPI changes: compare a segment’s share of the change with its share of the measure beforehand. A segment that makes up 90% of a metric should account for most of its movement, and a 10% segment accounting for 90% of it is the one to look at. Her guide has the formulas and the code, plus a detour through a 1973 study of graduate admissions at Berkeley, the classic case of mix turning a headline upside down.
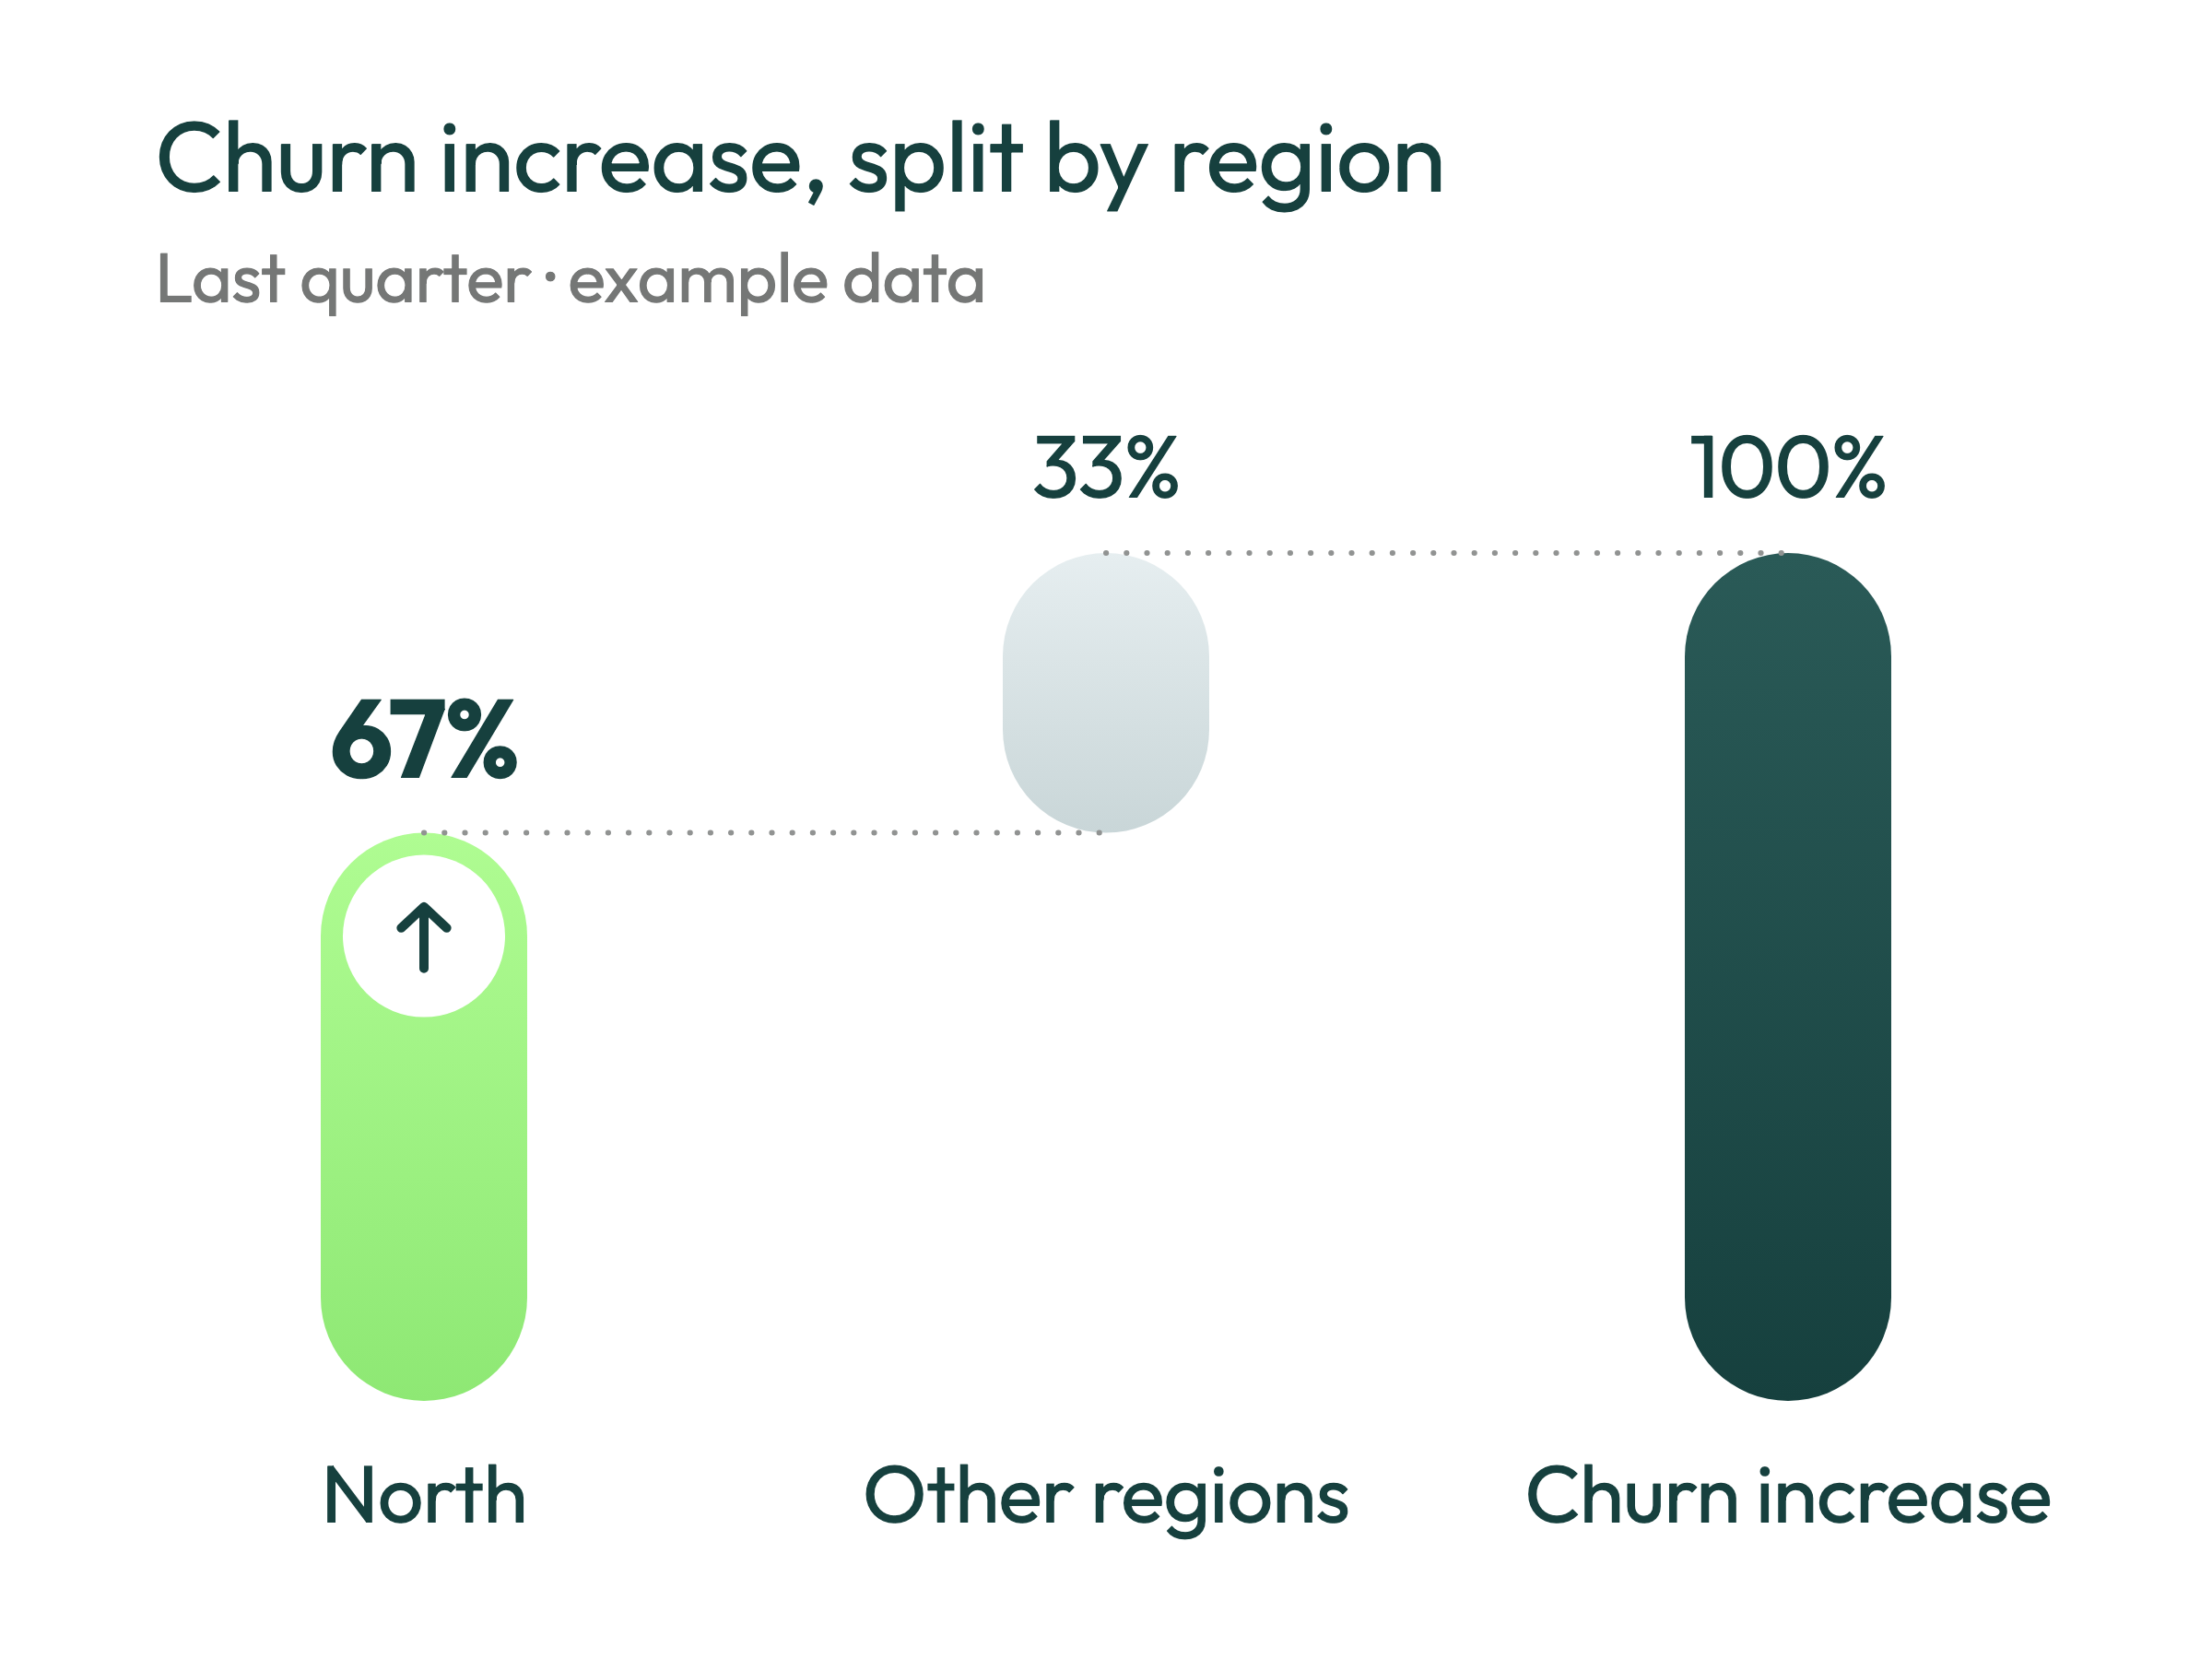
To show the shape of the answer, take a made-up example in which churn rose last quarter. Split by region, the waterfall reads: the North region contributed 67% of the churn increase, and the remaining 33% is spread across the other regions, which sends you to North next.
Why should the maths run in SQL rather than in the model?
Ask a language model why churn rose and it will often give you a percentage, fluently written, that nobody can rerun. A language model predicts the next likely word. A plausible figure and a checked figure look identical on the page, and nothing inside the model can tell them apart.
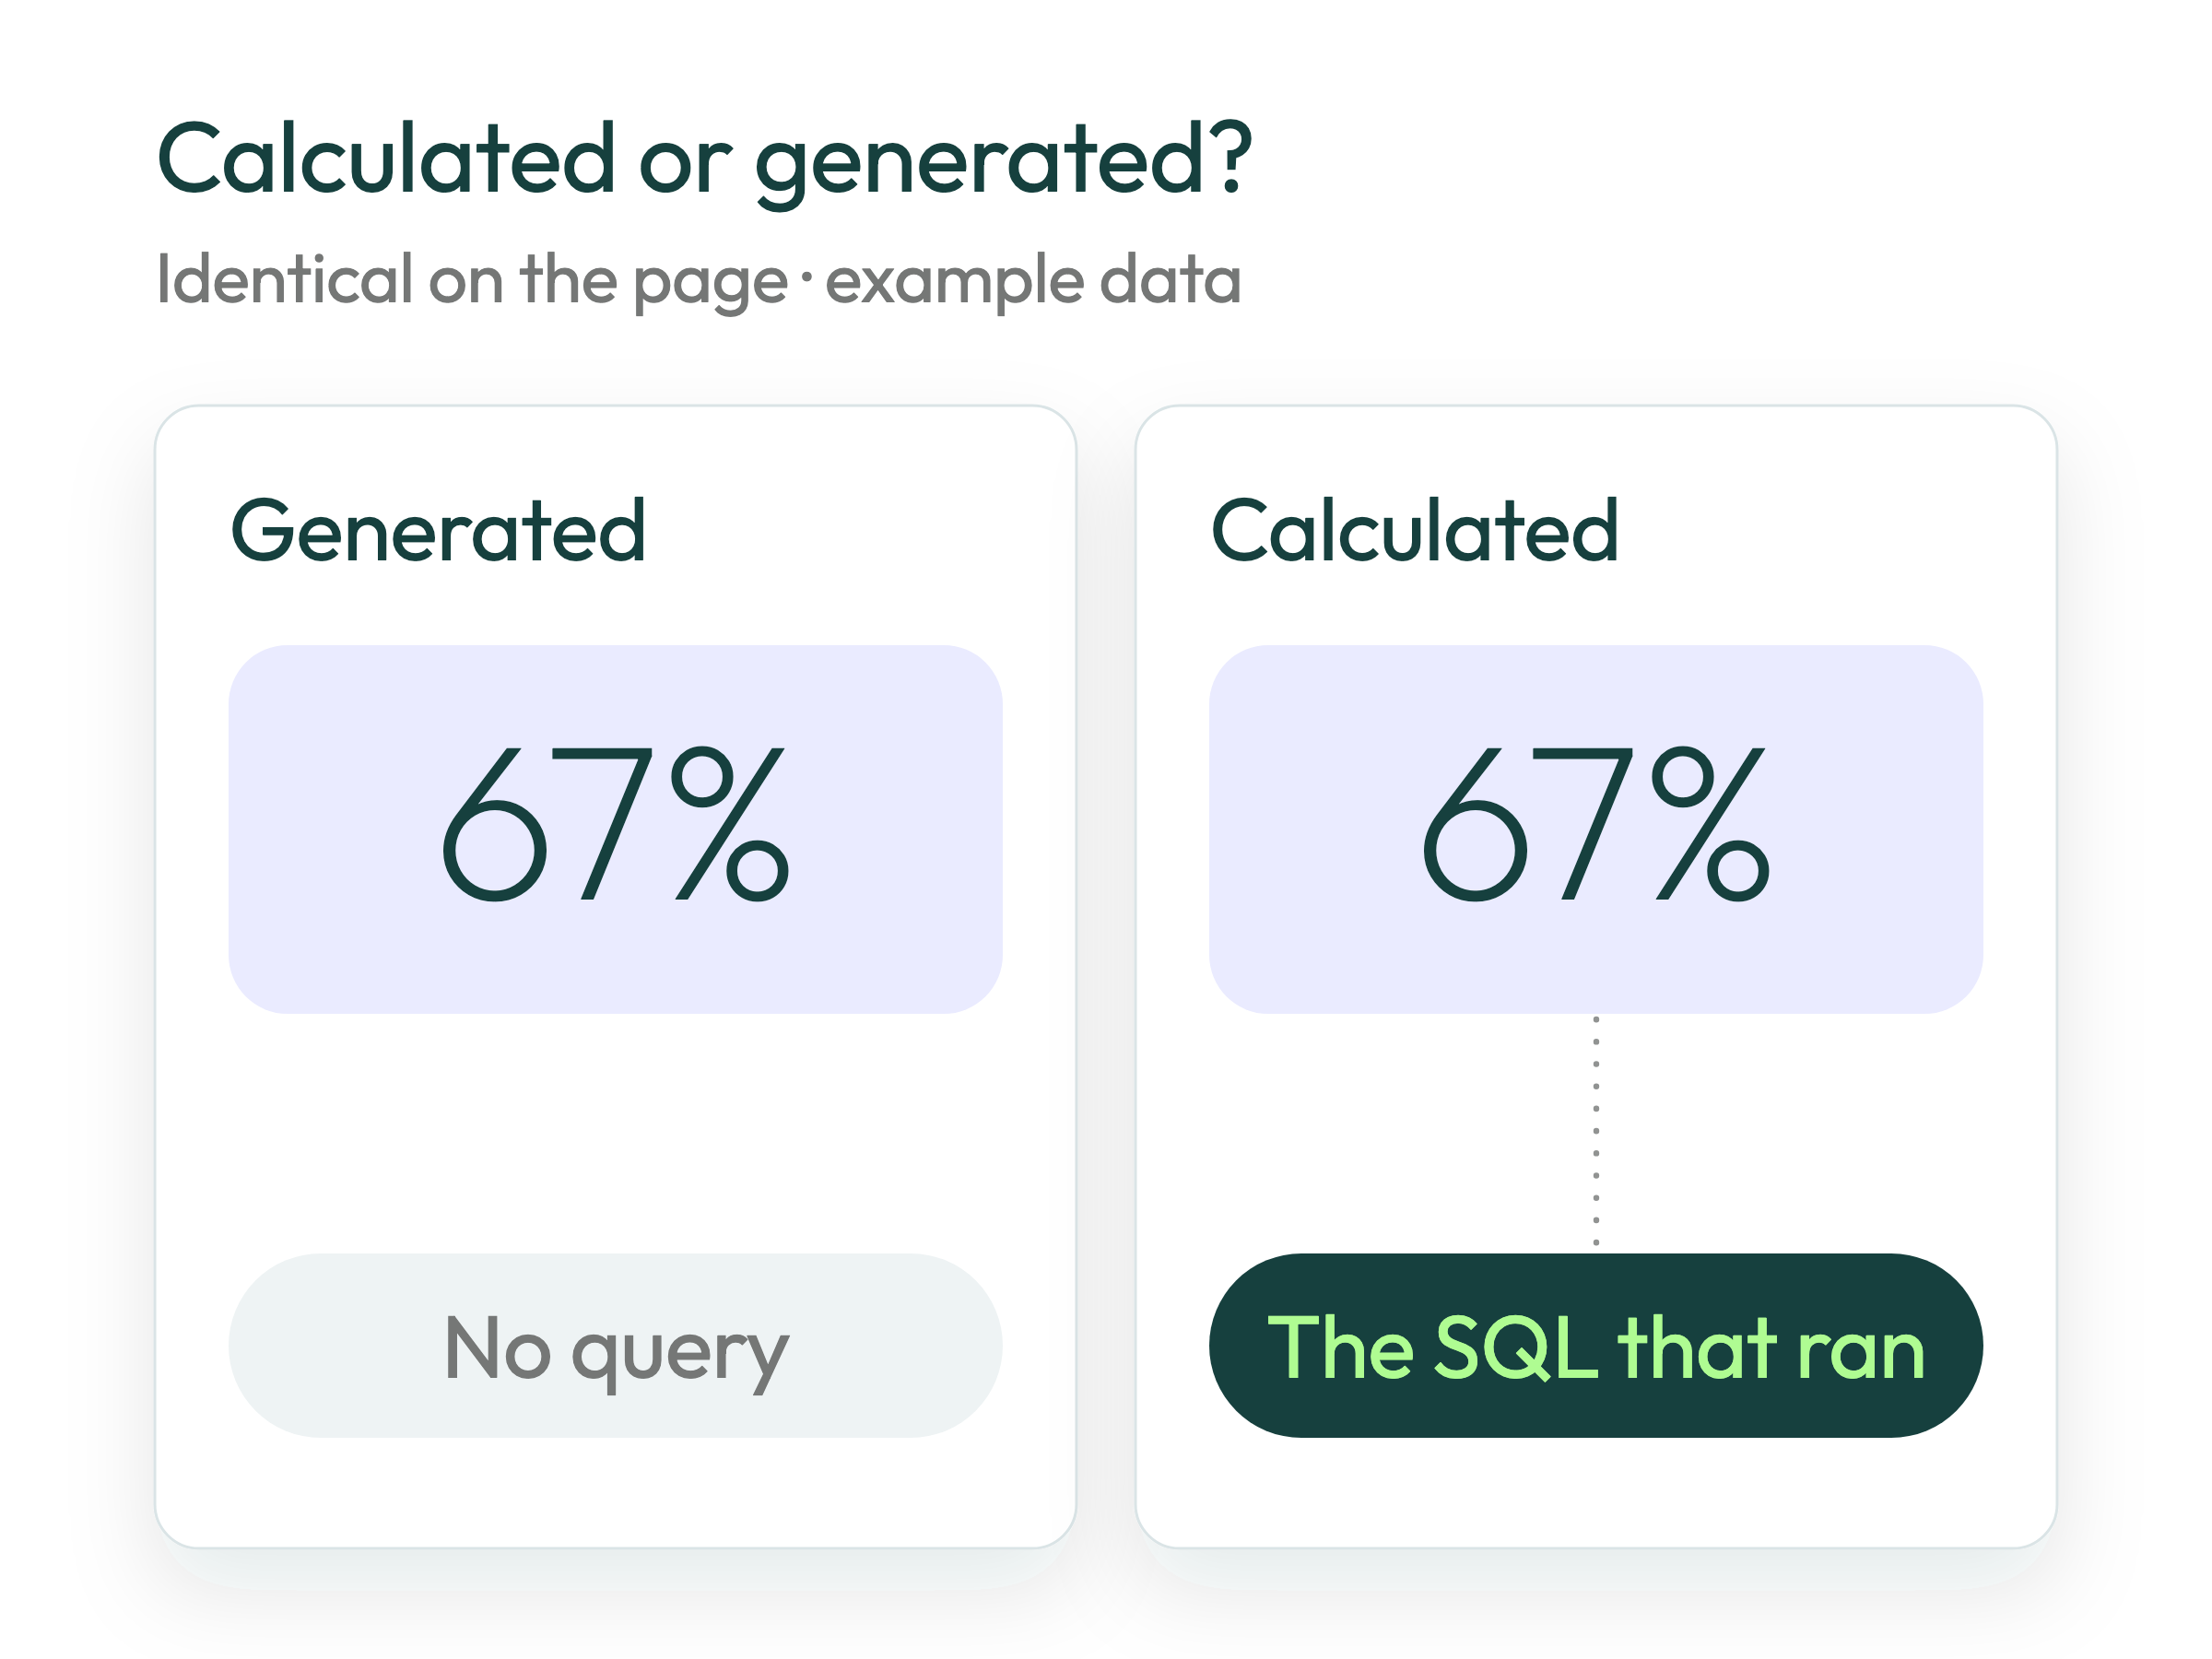
So in Unloq the model plans the analysis and explains the result, and it never does the arithmetic. The planner turns your question into a plan, and each driver’s contribution is computed in SQL against your own data. Before anyone sees the answer, a validation gate checks every figure against the SQL that produced it and grades it pass, warn or block. A warn arrives with its caveat attached, and a block withholds the figure. The answer carries the SQL that ran, so your analyst can see exactly how the split was calculated. Where Unloq reads your database directly, they can rerun the query and get the identical split. If our waterfall says North contributed 67%, that number is a calculation, not an opinion.
Definitions matter as much as the sums. Churn can mean a customer who cancelled, a customer who let a contract lapse at renewal, or a customer whose spend fell to zero, and each produces a different waterfall from one dataset. Unloq resolves every term against definitions your team has agreed, held in a semantic layer that runs as a service each time a question is asked, so churn in March means what churn meant in June.
I half-disagree with Mansurova on where this goes next. Her guide closes with the plan to build an LLM agent that will do the whole analysis and summary. I’d want that agent planning the analysis and writing the summary, with a query doing the arithmetic in between. Her post does not say how the agent would do the sums, and she may well intend it to call code, in which case we agree. My worry is the version where the percentage on the slide came out of the model.
The question I would put to any vendor, us included, is whether a given share was calculated or generated. Ask to see the query. If there is no query, you are reading the model’s best guess.
What can a driver split not tell you?
A driver split tells you where a change sits across the dimensions in your data, and it cannot see past them. If churn rose in North because a competitor opened two depots there, or because a regional manager changed the renewal terms in a meeting with no minutes, the split points at North and stops. Documents and the people who were there fill in the rest.
A share is also arithmetic, and arithmetic is no evidence of cause. North’s 67% might trace to one large account, a price rise, or a quirk in how North customers were coded. A pattern inside one segment needs testing before anyone acts on it, which is why the accountants hand the why to a manager.
A split also inherits whatever definition of churn sits underneath it, and agreeing that definition is still your team’s job.
The cleaner the waterfall, the more confident a room feels about a cause the waterfall never measured. I have no tidy fix for that, beyond treating a sharp split as the start of the next question.
Where can you see this in Unloq?
In Contextualise, you ask why a number moved and Unloq returns each driver’s share as a waterfall, computed in SQL, with the query alongside it and every figure checked before it reaches you. The platform page has more on how Unloq shows why a number moved. Once you know where a change sits, the next decision is what to do about it, and that is where Unloq’s recommendations pick up.

Written by
Co-founder and CTO, Unloq
Satyen is Unloq’s co-founder and CTO. He leads the engineering and applied science behind the platform, including the checks that trace every figure to its source and test every forecast against the client’s own history. He has taken startups from $0 to $20m+ revenue as a co-founder, and holds an Oxford MBA.
Questions we get asked
Got a question about this?
Send it to us and one of the team will come back to you with an answer.
Ask a question

